Localization based performance, and site speed optimization
Maps helped nations prepare for the 2020 global census. Population and housing data are critical to formulating policies to improve socioeconomic progress towards the UN Sustainable Development Goals.
Leapfrog from paper to mobile and digital flows
Mapping modernization efforts helped Least Developed Countries (LDCs) and Small Island Developing States (SIDS)
The internet is not equal
For many communities across Asia, the Pacific, Sub-Saharan Africa, the internet is limited, slow, on mobiles, and cripplingly expensive
Team
Me — Snr UX Designer
Paul Briseno — Snr UI
Designer Chase — Developer

Legacy paper based mapping and cartography departments

Discovery
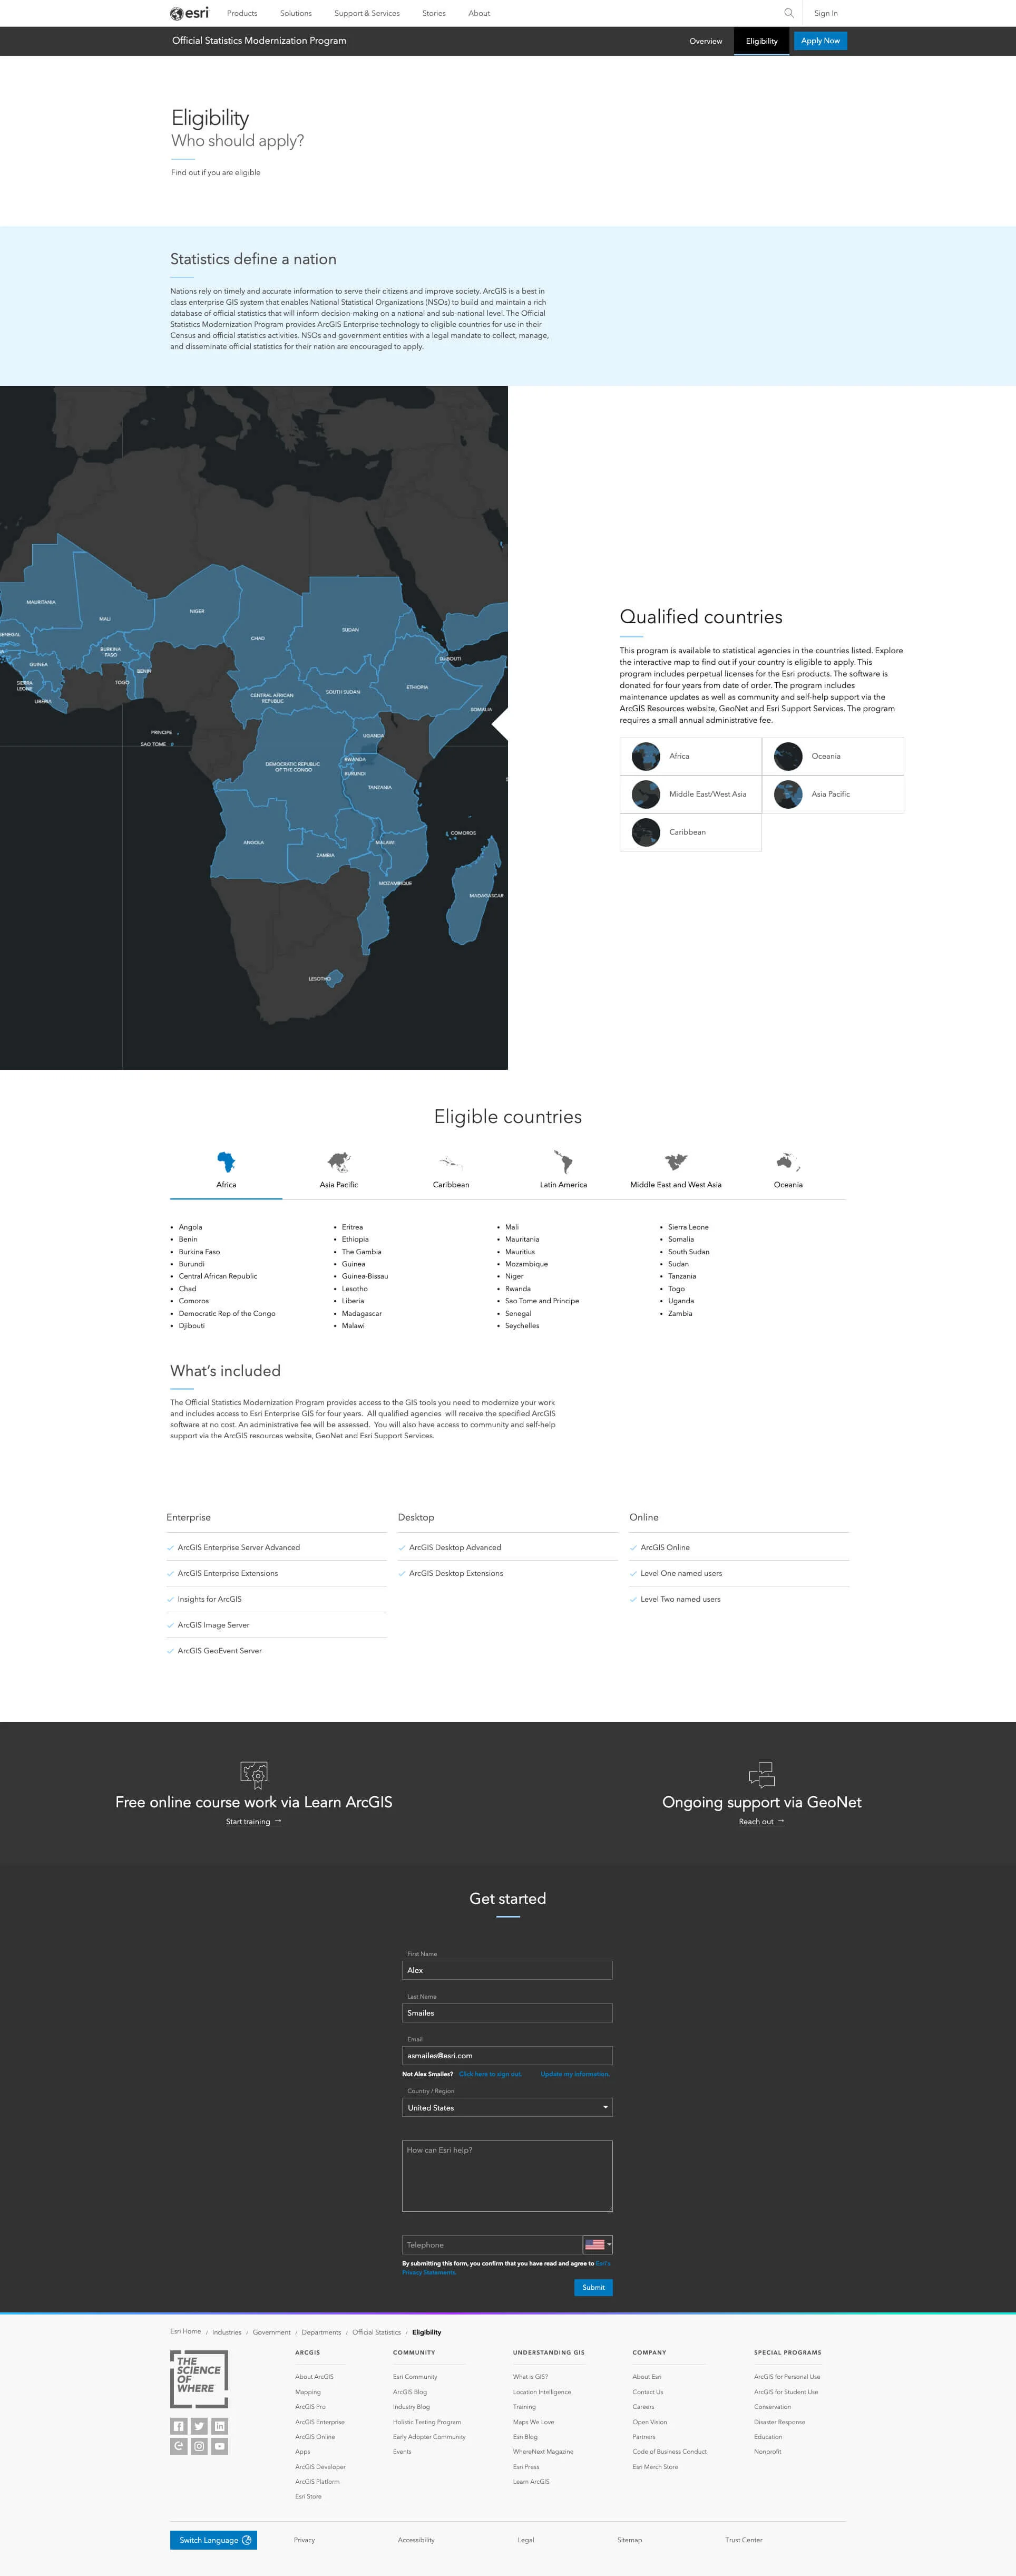
The global experience
Esri launched an Official Statistics Modernization Program website providing subsidized access to ArcGIS software. After we reviewed the existing offer site, we realized we needed a full redesign so it would be usable to anyone, anywhere.


Internet access
We identified nations with the least access to the internet and compared them with our target audience list, which unfortunately closely matched.
Speed and cost
After Egypt, countries with the slowest speeds had the most visits
Countries with the slowest speeds had the most expensive costs
So they were forced to spend more time on site
Ave page view was (3:15)
Chrome browser was used mostly on mobile
Performance
Using Adobe Analytics and site speed testers, we explored our audience’s current experience on our global website.
Visits
Device
Browser
Time spent
We got some good insights about use and performance by location
Strategy
Our vision was clear. We needed equitable experience for all
It’s all about the tech
Website must work on any mobile device with a 2G or 3G network
Universal visuals
Imagery and visuals that any role in government departments can interpret
Universal language
Enable government employees to confirm they are eligible for grants without English as a primary language
Setting a load time benchmark
We tested our current site that represented our usual approach of beautifully rich pages that display heavily layered photos.

Location A
California, US

4.32 seconds
While not great, well within acceptable web standards
Location B
Bagdad, Iraq

32.66 seconds!
Catastrophic. This would obviously trigger abandonment and was the reason for such low visits from these nations suffering to operate with these internet speeds.
Solutions
Content strategy


UX changes
Our most important design principle was using load speed and visit time as a positive constraint. It forced deeper thinking and earlier collaboration with our development team.
Wireframes


Universal language
Maps are an ideal tool when people need to self-identify where they live. No translation is necessary.

UI changes
By utilizing a 2-tone color system with 2D flat illustrations, it eliminated the usual heavy Photoshop files. The designer also experimented with exporting to gifs, rather than png, or jpeg files.
Key results
50% reduced the file size of every image
All the visual assets did not exceed 300KB
The total site size was 1.70MB


Code optimization
Developers implemented lazy load as well as other major dev and responsive updates.
Key results
Phenomenal Dev QA results
The only low ratings were due to the larger site
We aimed to take our usual standard of meeting AA to AAA

We tested it again
The team huddled around our study awaiting nail-biting results…
Location B
Bagdad, Iraq

6.85 seconds!
Load time that exceeded our expectations

Final
This site should be usable, functional, and fast on any device, network, anywhere in the World.
Key takeaways
Within 48 hours of launch at a UN conference, four countries, and the CARICOM region signed up.
A flexible design system of pages and components for our teams doing business in developing nations. As usual, highlighted the importance of having the developer's voice included during strategy and design stages.
But…
It also exposed that 80 out of 195 markets have a diminished experience on our global website.
What I’d do next…
Create localized imagery content personalized by location
Evangelize alternative approaches to visuals and imagery to reduce file sizes.
Redirect migration has also improved speeds over time.
Use local language spellings in the countries list e.g Espanola for Spain.